State of the Health Funds Report 2022 (HTML)
Relating to the financial year 2021-22
Report required by s 20D(c) of the Ombudsman Act 1976 (Cth) (Ombudsman Act).
All material presented in this publication is provided under a Creative Commons Attribution 3.0 Australia licence (creativecommons.org/licences).
This material may be copied, distributed, transmitted or adapted (including for commercial purposes) provided the Office of the Commonwealth Ombudsman is credited as the creator and is not represented as endorsing your use of the material.
To avoid doubt, this licence only applies to the material as set out in this document.
The details of the relevant licence conditions are available on the Creative Commons website, as is the full legal code for the CC BY 3.0 AU licence (creativecommons.org/licences/by/3.0/au).
Under the Coat of Arms-the terms under which the Australian Coat of Arms may be used are detailed on the Department of the Prime Minister and Cabinet website (www.pmc.gov.au/honours-and-symbols/commonwealth-coat-arms).
Foreword

I am pleased to present the 18th annual State of the Health Funds Report, relating to the financial year 2021-22. The Ombudsman Act requires the Private Health Insurance Ombudsman (PHIO) to publish the report after the end of each financial year to provide comparative information on the performance and service delivery of all health insurers[1] during that financial year.
The information in the report supplements information available on our consumer website privatehealth.gov.au. The consumer website provides a range of information to assist consumers to understand private health insurance and to select or compare private health insurance policies.
This report provides consumers with additional information that may assist them to make decisions about private health insurance. For existing policyholders, the report details information that allows them to compare the performance of their insurer with all other health insurers. For those considering taking out private health insurance for the first time, the report outlines the services available from each insurer and compares their performance.
The range of issues and performance information contained in the report was chosen considering the availability of reliable data and whether the information can reasonably be compared across insurers. The information included in the report is based on data the Australian Prudential Regulation Authority (APRA) collects as part of its role to monitor and report on the financial management of health insurers. I thank APRA for its assistance and advice to my Office in preparing this report.
Iain Anderson
Commonwealth Ombudsman
March 2023
Contents
List of Figures
List of Tables
Using this report to compare insurers
Please note:
- Nothing in this report should be taken as this Office recommending any health insurer or health insurance policy.
- No single indicator should be used as an indicator of an insurer's overall performance.
- The information used in this report to compare health insurers is based on data collected for regulatory purposes. This information was the most appropriate, independent and reliable data available at 1 December 2022.
- This report may help consumers decide which health insurers to consider but will not indicate which policy/ies to purchase. Most insurers offer more expensive policies that can be expected to provide better than average benefits, as well as cheaper policies that provide less benefits.
The State of the Health Funds report
The State of the Health Funds Report (SOHFR) compares how health funds perform across the following criteria:
- service performance and financial management
- hospital benefits
- medical gap schemes
- general treatment (extras) benefits.
Consumers can use the information in this report to identify insurers or assess their current insurer's performance relative to other insurers.
The range of indicators included in this report allow consumers to focus on factors of most importance to them, noting that not all factors will be of equal importance to every individual or family.
More information about specific indicators is provided in the explanations preceding each of the tables in this report.
Where to find more information about selecting a policy
The Ombudsman's consumer website privatehealth.gov.au includes advice about what factors to consider and what questions to ask when selecting a policy. It also includes information about government incentives relating to hospital cover such as the 'Medicare Levy Surcharge Exemption' and 'Lifetime Health Cover'.
This report does not include detailed information on price and benefits for health insurance policies. Information on specific policies is available from privatehealth.gov.au, where you can search for and compare information about every health insurer and policy in Australia.
Brochures and factsheets about private health insurance can be found at ombudsman.gov.au.
Insurer names
This report refers to health insurers by an abbreviation of their registered name, rather than any brand name they might use. This abbreviated name appears on the left side of the heading for each insurer in the Health Insurer Listing section. Some insurers use several different brand names or have used brand names in the recent past:
Brand name | Insurer |
|---|---|
AAMI | NIB |
APIA | NIB |
Astute Simplicity Health | St Lukes |
Australian Health Management | Medibank |
Budget Direct | GMHBA |
Emergency Services Health | Police Health |
Frank | GMHBA |
GMF Health | HBF |
GU Corporate Health | NIB |
Health.com.au | GMHBA |
Healthguard | HBF |
Hunter Health Insurance | CDH |
iSelf | Phoenix |
Kogan | Medibank |
Manchester Unity | HCF |
MyOwn Health | AIA Health |
NRMA Health | BUPA |
Nurses and Midwives Health | Teachers Health |
Qantas Assure | NIB |
Railway and Transport (RT) Health | HCF |
Suncorp | NIB |
Territory Health | QCH |
UniHealth | Teachers Health |
Union Health | TUH |
About the data used in this report
Open and restricted membership health insurers
Membership of 'open' health insurers is available to everyone.
'Restricted membership' health insurers have certain membership criteria which mean they are not available to all consumers. For example, membership may be restricted to employees of certain companies, occupations or members of particular organisations.
Where applicable, open and restricted membership funds are listed separately in each of the tables in this report.
Data collection
Most data used in this report is collected by the industry regulator APRA. While insurers report to APRA for regulatory purposes, some of this information is useful to consumers and is reproduced in this report. However, it is important to read the accompanying text explaining the data in conjunction with the tables.
As funds differ in size, most of the statistical information is presented as percentages or dollar values per membership, for easier comparison. We have not weighted the importance of various indicators, as these are subjective judgements that consumers are better placed to make based on their individual circumstances, preferences and priorities. For this reason, we do not consolidate or average an insurer's scores across indicators to provide an overall performance or service delivery score.
The report provides consumers with additional information about the benefits each insurer paid over the last year. The report also provides information about the extent of coverage insurers provided for hospital, medical and general treatment, as well as any state-based differences in coverage. The indicators we have used in this report are not intended to represent the full range of factors that consumers should consider when comparing insurers' performance. Rather, they are limited to those for which there is reliable data which can reasonably be compared across all insurers.
Key consumer issues
In 2021-22, complaints to the Office decreased by 22.7 per cent compared to 2020-21, continuing a trend from the previous year.
Part of the reason for the decline appears to be the long-term positive impact of the private health insurance reforms that came into effect from 1 April 2020. The reforms aimed to address consumer sentiment that health insurance was too complex by implementing a system of product 'tiers' and clinical categories.
More effective servicing of customers and more effective complaint handling by several health insurers also contributed to the decline in complaints seen by the Office.
Private health insurance activity fell during COVID-19 restrictions as people were not always able to attend private hospitals, dentists and other providers. The effect of restrictions on complaint numbers seems to have been limited, however, as claims increased by 0.6 per cent in the year from June 2021 to June 2022.[2]
Hospital-insurer disputes
Inflation may create a more challenging environment for insurers and hospitals seeking to renew their agreements in the near future.
Health insurers enter into agreements with hospitals to ensure that the prices charged match the amount the insurer is prepared to pay. Before an agreement reaches the end of its term, the insurer and hospital usually enter into negotiations to renew or extend the agreement. If an insurer and hospital cannot come to an agreement, one party may give notice of their intention to terminate the agreement.
The Australian Competition and Consumer Commission's (ACCC) Private health insurance report 2021-22 noted that the 6.1 per cent annual rise in consumer price index (CPI) inflation for 2021-22 was the largest rise since the introduction of the goods and services tax, and that private hospital industry may face staff shortages which could drive higher wage costs. However, the ACCC also noted that health inflation (referring to health goods and services) for 2021-22 was at 2.4 per cent, well below the broader inflation rate of 6.1 per cent. [3]
The Commonwealth Ombudsman, in their capacity as the Private Health Insurance Ombudsman (PHIO), has legislative power to invite or require health insurers and healthcare providers to attend mediation, to seek to resolve disputes that may affect consumers' rights and entitlements under their private health insurance cover. This includes disagreements between a health insurer and a hospital provider about the renewal of a hospital agreement.
Under Part IID, Division 5 of the Ombudsman Act 1976 (the Act), the Ombudsman can conduct mediation between health insurers and hospitals on a voluntary basis or may direct parties to participate in mediation.
The Ombudsman decides whether to conduct mediations on a case-by-case basis. The Office's involvement in contractual disputes between health insurers and healthcare providers is guided by whether there is likely to be a significant impact on consumers' rights under private health insurance arrangements.
If the Ombudsman directs the parties to participate in mediation, the Office expects the parties to act in good faith and in the interests of consumers in trying to achieve a resolution of the dispute. Mediation ceases if the parties agree to a resolution of the matter, or the Office concludes that the matter cannot be settled by mediation.
The purpose of mediation is to assist the parties to reach a position where direct negotiation between them is likely to resolve the matter. Mediation does not involve the Ombudsman ruling on the relative merits of the parties' negotiating positions or the prices they are seeking to pay or receive. Commercial and competition issues fall within the jurisdiction of ACCC.
The Office's Mediation Guidelines and Termination and Transition Guidelines can be found on the Ombudsman website.
Medibank cyber incident
On 12 October 2022 Medibank Private detected suspected data theft on their systems. Since that time the data theft has been confirmed and the scale of the incident has grown to include all personal data and significant amounts of health claims data.
In response to the incident, Medibank wrote to impacted consumers and provided support services. The Government also increased penalties for companies that do not take adequate care of customer data and is strengthening privacy laws.
The Australian Federal Police (AFP) commenced an operation in response to the Medibank data breach and the Government activated the National Coordination Mechanism (NCM) to ensure that all possible support is provided to Medibank and those affected by the incident. The Office of the Australian Information Commissioner (OAIC) also commenced an investigation into Medibank's personal information handling practices.
The privacy and data aspects of this matter fall outside the Office's jurisdiction. However, it remains an issue of concern to consumers and Medibank policy holders can ask the Office for help about a broad range of issues and access our services if they are unsatisfied with a response to a problem raised with their insurer. As of December 2022, the Office had received over 100 complaints about this issue.
One theme in the complaints made to the Office by both current and former members of Medibank was the extent of the historical data retained by Medibank and the length of time it was retained. Some consumers whose details were stolen had not been members of Medibank for several years.
Some state and territory regulations determine the length of time that data must be retained before it can be destroyed, and Australian insurers are required to keep some basic information including length and type of membership indefinitely for purposes such as Lifetime Health Cover (LHC) records. However, some complainants felt data may have been retained by Medibank beyond the minimum requirements and suggested that, if data been appropriately destroyed or de-identified at an earlier stage, the impact of the data theft would have been mitigated.
Overview of complaints in 2021-22
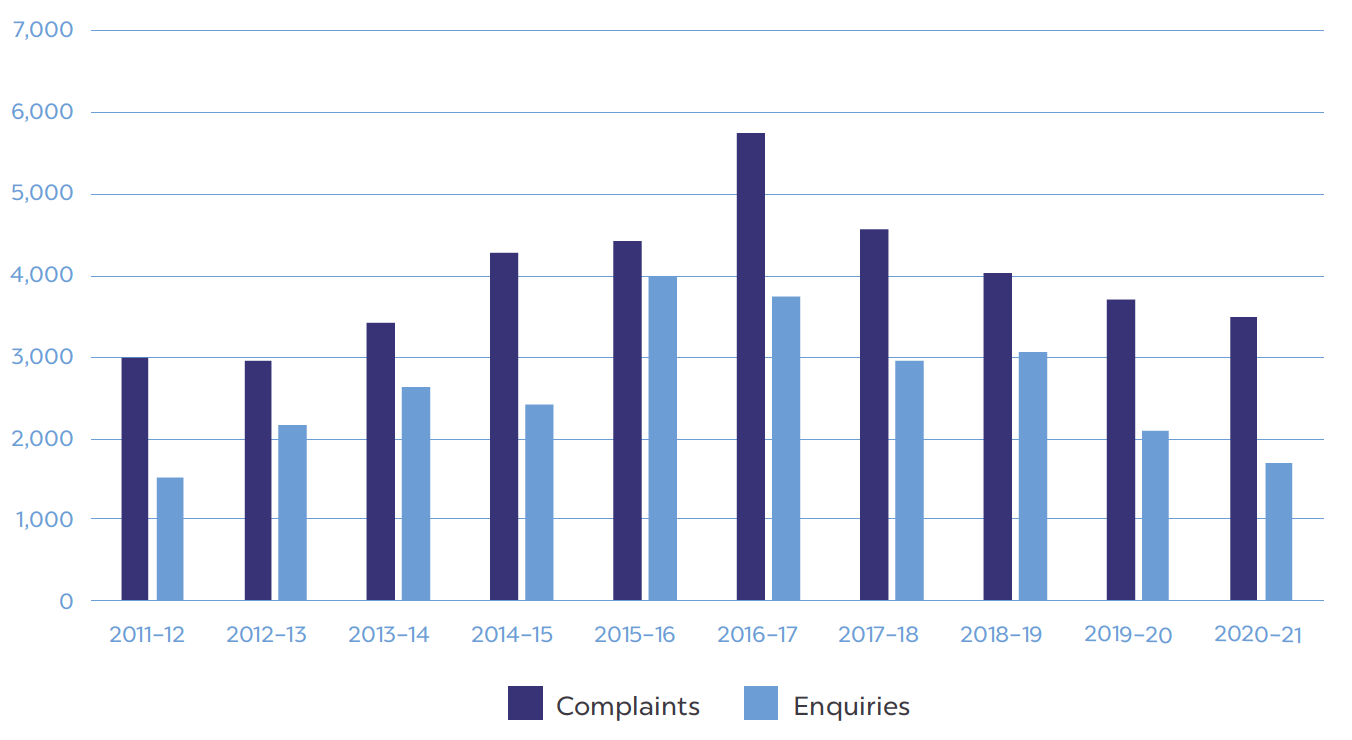
In 2021-22, the Office received 2,704 complaints about private health insurance, a 22.7 per cent decrease compared to the number we received in 2020-21. In the same period, we also received 1,744 private health insurance enquiries, which is a 2.3 per cent increase on the previous year. Enquiries are matters we resolved by providing general advice or information, or which involved matters outside of our jurisdiction.
Figure 1: Total complaints and enquiries by year
Complaints
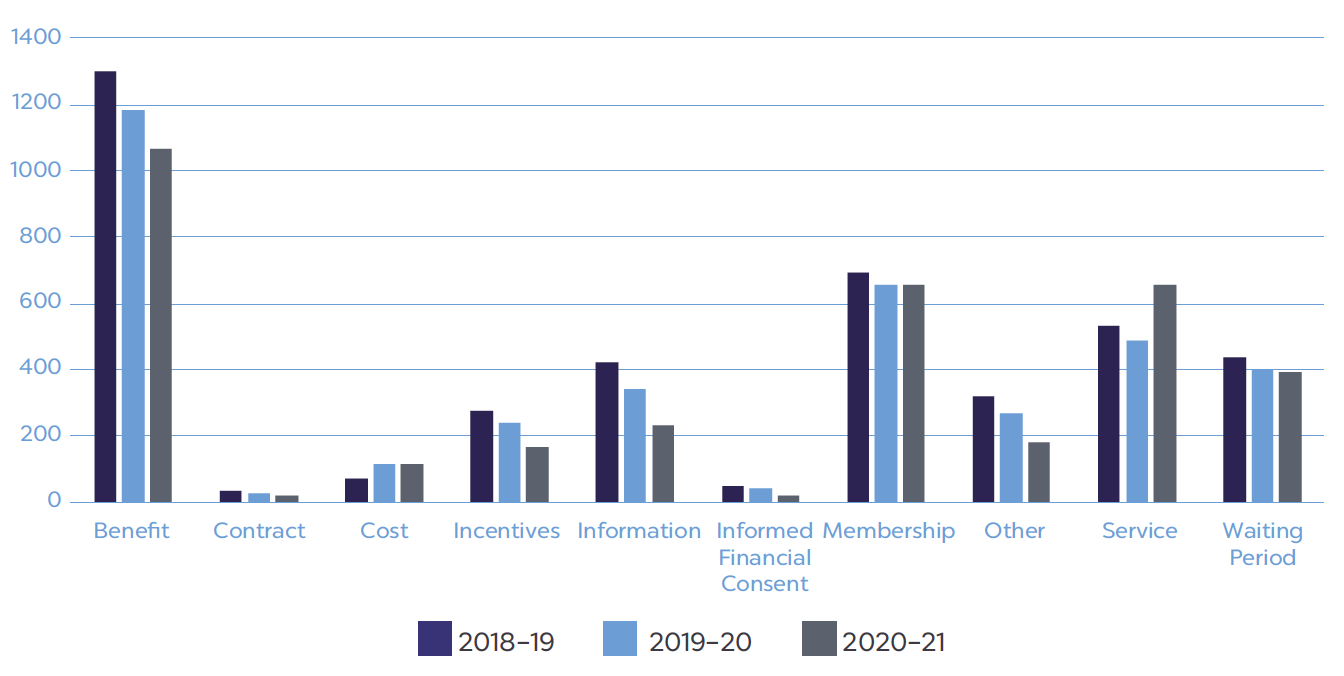
During 2021-22, the most common issues in consumer complaints related to benefits, membership and service. Complaints about service and membership increased this year compared to 2020-21, while complaints about benefits decreased.
Complaints about benefits include those about general treatment (extras/ancillary) benefits and unexpected hospital policy exclusions and restrictions, typically about the amount paid for the service or timeliness in processing claims.
Complaints related to membership cancellation generally reflect problems and delays in insurers processing requests to cancel memberships and handling associated payments or refunds. In most cases, they arise from consumers transferring from one insurer to another, rather than people leaving private health insurance altogether.
When consumers contact us about an insurer's service, it's rarely the sole reason for their complaint. In our experience, they usually flow from another issue which, when combined with poor customer service, inadequate or delayed responses and poor internal escalation processes, cause policy holders to become increasingly dissatisfied.
Complaints about information include complaints about verbal advice, where the insurer and member disagree about what information was provided in a phone call or retail centre, as well as complaints about the clarity or accuracy of written information on websites, brochures and in email or letters.
Complaints related to decisions to refuse or reduce claims based on pre-existing conditions tend to result from insurers not clearly stating which signs and symptoms it relied on to assess a claim. In these cases, the Office can seek a better explanation of the insurer's medical practitioner's decision, as well as obtain an impartial review of the decision based on the medical evidence.
Figure 2: Complaint issues over previous three years
Enquiries
Most enquiries the Office received during 2021-22 were about how private health insurance works and Lifetime Health Cover.
Thirty-one per cent of enquiries in 2021-22 were about general private health insurance issues, including about what factors consumers should consider when selecting a policy.
Twenty-nine per cent of enquiries were about Lifetime Health Cover (LHC). LHC is a policy designed to encourage people to take out hospital insurance earlier in life and maintain their cover. It imposes a loading on membership premiums for every year the member is aged over 30 when taking out cover, which is then removed after 10 years of continuous coverage.
Consumers also contacted our Office to seek information about government incentives such as the government rebate and Medicare levy surcharge, health insurance for overseas visitors to Australia, the role of the Private Health Insurance Ombudsman and general advice about Australia's healthcare system.
Consumer website privatehealth.gov.au
The website privatehealth.gov.au is Australia's leading independent source of consumer information about private health insurance. It is also the only website that allows users to search the features and premium costs of every policy available in Australia.
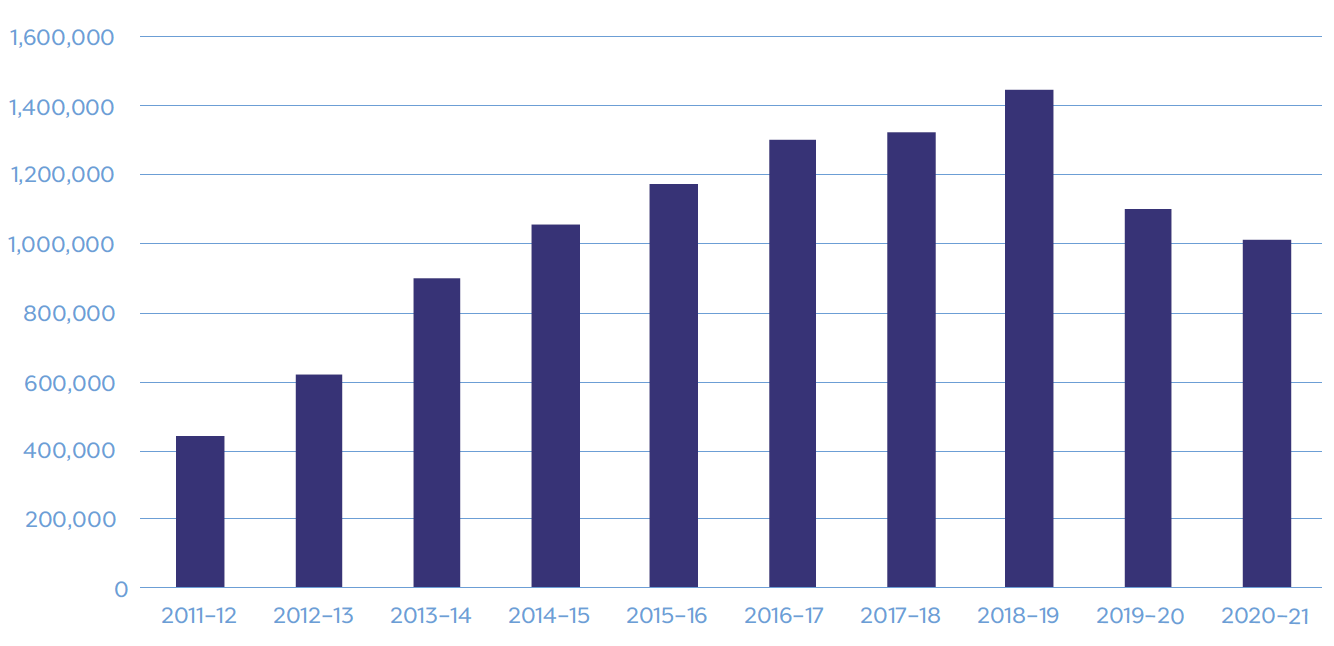
During 2021-22, visits to the website increased by 14.2 per cent with to 1,156,679 unique visitors compared to 1,012,439 visitors in 2020-21. The website largely relies on organic growth, with most visitors discovering the website through search engines.
Figure 3: Privatehealth.gov.au visitors per year
Health insurers listing
The following table lists all Australian registered health insurers. The 'open' membership insurers provide policies to the general public. The 'restricted' insurers provide policies through specific employment groups, professional associations or unions.
During 2021-22 RT Health merged with HCF and Nurses & Midwives Health merged with Teachers Health. For this reason, some of the fields in this report relating to those insurers may be displayed as 'not applicable'.
Table 1: Health insurers listing
Open membership health insurers | |
|---|---|
Abbreviation | Full name or other names |
AIA Health | AIA Health Insurance, MyOwn Health Insurance |
Australian Unity | Australian Unity Health Ltd |
BUPA | Bupa HI Pty Ltd |
CBHS Corporate | CBHS Corporate Health Pty Ltd |
CDH | CDH - Hunter Health Insurance |
CUA Health | CUA Health Ltd |
GMHBA | GMHBA Ltd, Frank, Health.com.au |
HBF | HBF Health Ltd |
HCF | Hospitals Contribution Fund of Australia |
HCI | Health Care Insurance Ltd |
Health Partners | Health Partners Ltd |
HIF | Health Insurance Fund of Australia Ltd |
Latrobe | Latrobe Health Services |
MDHF | Mildura Health Fund Ltd |
Medibank | Medibank Private Ltd, Australian Health Management |
NIB | NIB Health Funds Ltd, Qantas Assure, APIA |
Onemedifund | National Health Benefits Australia Pty Ltd |
Peoplecare | Peoplecare Health Insurance Limited |
Phoenix | Phoenix Health Fund Ltd |
QCH | Queensland Country Health Fund Ltd |
St Lukes | St. Lukes Health |
Transport Health | Transport Health Pty Ltd |
Westfund | Westfund Limited |
Restricted membership health insurers | |
|---|---|
Abbreviation | Full name or other names |
ACA | ACA Health Benefits Fund |
CBHS | CBHS Health Fund Ltd |
Defence Health | Defence Health Ltd |
Doctors' Health | The Doctors' Health Fund |
Navy | Navy Health Ltd |
Nurses and Midwives(1) | Nurses and Midwives Health Pty Ltd |
Police Health | Police Health Limited, Emergency Services Health |
Reserve Bank | Reserve Bank Health Society Ltd |
RT Health Fund(2) | Railway and Transport Health Fund Ltd |
Teachers Health | Teachers Federation Health Ltd |
TUH | Teachers' Union Health Fund |
(1) Nurses and Midwives merged with Teachers Health on 1 January 2022.
(2) RT Health Fund merged with HCF on 1 November 2021.
Service performance and finances
Member retention
The member retention indicator is used as one measure of the comparative effectiveness of health insurers and their level of member satisfaction. This indicator measures what percentage of insurer members (hospital memberships only) have remained with the insurer for 2 years or more.
This figure is calculated on the total gain or loss of members over the last 2 years, considering consumers who take up membership and leave within that 2 year period. Figures are not adjusted for policies that lapse when a member dies, as these are not reported to APRA.
Most restricted membership insurers rate well on this measure compared to open membership insurers. This may be due to features particular to restricted membership insurers, especially their links with employment.
Ombudsman complaints in context
The number of complaints we receive is very small compared to insurer membership.
There are several factors (other than share performance) that can influence the level of complaints we receive about an insurer. These include the information the insurer and the media provide to members about the Ombudsman and the effectiveness of the insurer's own complaint handling process.
Complaints percentage compared to market share percentage
Table 2 shows each insurer's market share (as at 30 June 2022) in the market share column. Subsequent columns show the complaints we received about each insurer, as a percentage of the total complaints we received about all insurers. These percentages should be compared with insurers' market share figure. Where an insurer's share of complaints was higher than its market share, this indicates that members of that insurer were more likely to complain than those of other similar sized insurers.
The table also indicates the percentage of complaints we received about each insurer:
All complaints takes account of all complaints received by this Office about the insurer. All complaints includes complaints investigated as well as complaints that were finalised without the need for investigation.
Complaints investigated[4] is a measure of the percentage of complaints that required a higher level of intervention from the Ombudsman, in relation to all complaints investigated. Most complaints to the Ombudsman can be finalised by referring the matter to insurer staff to resolve or by Ombudsman staff providing information to the complainant. Complaints which insurer staff have not been able to resolve to a member's satisfaction are investigated by the Ombudsman's Office, so the rating on complaints investigated is an indicator of the effectiveness of each insurer's own internal complaint handling.
Finances and costs
All health insurers are required to meet financial management standards, to ensure their members' contributions are protected. Generally, insurers aim to set premium levels so their income from contributions covers the expected cost of benefits plus the insurer's administration costs.
The regulation of health insurer finances
The Private Health Insurance Act 2007 (Cth) (the Act) specifies solvency and capital adequacy standards for insurers to meet and outlines financial management and reporting requirements for all insurers.
APRA produces an annual publication providing financial and operational statistics for the insurers for each financial year.[5] Information included in the Benefits as a Percentage of Contributions and Management Expenses fields is drawn from data collected by APRA.
Benefits as a percentage of contributions
This column shows the percentage of total contributions, received by the insurer, returned to contributors in benefits. Insurers will generally aim to set premium levels so that contribution income covers the expected costs of benefits plus the insurer's administration costs.
Management expenses
Management expenses are the costs of administering the insurer. They include items such as staff salaries, operating overheads, and marketing costs.
As a percentage of contribution income: This figure is regarded as a key measure of insurer efficiency. In this table, management expenses are shown as a proportion of total insurer contributions.
Per average policy: A comparison of the relative amount each insurer spends on administration costs. This figure shows management expenses per membership.
Table 2: Service performance and finances
Insurer Name | Member retention (hospital cover) [1] | Market share | All complaints % | Complaints investigated % | Benefits as % of contributions | Management expenses as % of contribution income | Management expenses per average policy |
|---|---|---|---|---|---|---|---|
Open membership insurers | |||||||
AIA Health | 69.0% | 0.3% | 1.2% | 2.5% | 82.8% | 13.5% | $464 |
Australian Unity | 79.2% | 2.4% | 4.6% | 2.5% | 76.9% | 12.7% | $501 |
BUPA | 87.7% | 24.7% | 23.6% | 13.9% | 81.6% | 9.8% | $371 |
CBHS Corporate | 71.0% | <0.1% | 0.0% | 0.0% | 87.2% | 14.9% | $604 |
CDH | 88.2% | <0.1% | 0.0% | 0.0% | 76.7% | 17.9% | $850 |
CUA Health | 76.1% | 0.5% | 0.2% | 0.0% | 78.5% | 9.4% | $371 |
GMHBA | 80.3% | 2.3% | 3.2% | 1.6% | 84.5% | 11.2% | $429 |
HBF | 92.3% | 7.3% | 5.9% | 4.9% | 88.1% | 14.7% | $495 |
HCF | 98.6% | 12.4% | 18.1% | 23.8% | 86.7% | 10.3% | $419 |
HCI | 89.0% | 0.1% | 0.1% | 0.0% | 75.4% | 11.3% | $527 |
Health Partners | 90.9% | 0.7% | 0.9% | 0.8% | 86.7% | 9.4% | $373 |
HIF | 77.0% | 0.7% | 1.3% | 5.7% | 80.8% | 13.6% | $471 |
Latrobe | 76.8% | 0.7% | 1.1% | 1.6% | 79.7% | 15.0% | $614 |
MDHF | 91.8% | 0.3% | 0.0% | 0.0% | 83.6% | 8.5% | $335 |
Medibank | 87.6% | 27.5% | 19.3% | 15.6% | 83.7% | 7.5% | $262 |
NIB | 81.9% | 9.4% | 9.3% | 5.7% | 73.5% | 10.7% | $374 |
Onemedifund | 93.6% | 0.1% | 0.0% | 0.0% | 75.7% | 9.7% | $603 |
Peoplecare | 84.7% | 0.5% | 0.1% | 0.0% | 84.7% | 10.8% | $485 |
Phoenix | 85.9% | 0.2% | 0.2% | 0.0% | 82.5% | 9.6% | $464 |
QCH | 89.0% | 0.4% | 0.3% | 0.0% | 83.5% | 10.6% | $519 |
St Lukes | 89.9% | 0.6% | 0.5% | 1.6% | 84.0% | 11.6% | $531 |
Transport Health | 80.3% | 0.1% | 0.2% | 0.8% | 84.6% | 15.9% | $649 |
Westfund | 88.3% | 0.9% | 1.0% | 2.5% | 79.7% | 12.9% | $542 |
Restricted membership insurers | |||||||
ACA | 91.9% | 0.1% | 0.0% | 0.0% | 78.7% | 12.1% | $693 |
CBHS | 93.0% | 1.5% | 2.5% | 5.7% | 87.8% | 10.4% | $486 |
Defence Health | 89.9% | 2.0% | 1.6% | 3.3% | 86.8% | 10.3% | $465 |
Doctors' Health | 90.5% | 0.5% | 0.4% | 0.0% | 82.3% | 11.4% | $579 |
Navy Health | 89.1% | 0.4% | 0.4% | 1.6% | 86.1% | 9.1% | $402 |
Nurses and Midwives[2] | N/A | N/A | 0.1% | 0.8% | 98.5% | 11.7% | $395 |
Police Health | 92.2% | 0.5% | 0.2% | 0.8% | 86.9% | 7.1% | $429 |
Reserve Bank[3] | 91.4% | <0.1% | 0.0% | 0.0% | 76.3% | 13.8% | $1,031 |
RT Health Fund | N/A | N/A | 0.3% | 0.0% | 82.8% | 17.0% | $744 |
Teachers Health | 92.4% | 2.6% | 2.7% | 4.1% | 86.4% | 8.4% | $400 |
TUH | 90.4% | 0.6% | 0.3% | 0.0% | 83.5% | 8.6% | $433 |
[1] The total gain or loss of members over the last two years, which takes into account consumers who take up membership and leave within that two year period.
[2] Nurses and Midwives merged with Teachers Health on 1 January 2022, so retention and market share are not applicable.
[3] RT Health merged with HCF on 1 November 2021, so retention and market share are not applicable.
Private hospital treatment
Table 3 provides a general comparison of health insurance for private patient hospital treatment. A higher percentage indicates that, on average, the insurer's members are covered for a higher proportion of private hospital charges.
The percentages indicated in this table are not indicative of any single policy but are an average of all policies offered by the insurer.
Hospital policies provide benefits towards the following costs if you elect to be a private patient in a private or public hospital:
- hospital fees for accommodation, operating theatre charges and other charges raised by the hospital
- the costs of drugs or prostheses required for hospital treatment
- fees charged by doctors (surgeons, anaesthetists, pathologists, etc.) for in-hospital treatment.
Most insurers offer a range of different policies providing hospital cover. These policies may differ in the range of treatments that are covered, the extent to which those treatments are covered, the level of excess or co-payment you may be required to pay if you go to hospital, and the price and discounts available to you.
Table 3 indicates the proportion of total charges associated with treatment of private patients covered by each insurer's benefits. This includes charges for hospital accommodation, theatre costs, prostheses and specialist fees (not including the Medicare benefit), excesses or co-payments and associated benefits.
Information is not provided for some insurers in some states, where APRA has not received reports of activity in that state - this generally occurs in states where the insurer does not have a large membership.
Hospital related charges covered (per cent) is calculated as: (Hospital benefits paid by insurer / Fees excluding Medicare benefit)*100.
'Fees' is the total amount the patient would have to pay to the provider(s) in the absence of any private health insurance, inclusive of hospital, medical and prostheses fees. This amount excludes the Medicare benefit. The difference between fees charged and benefits paid is the amount that the patient must pay (out of pocket).
The privatehealth.gov.au website provides information about all private health insurance policies available in Australia, including benefits, prices and agreement hospitals for each health insurer.
Table 3: Hospital
Fund name | % Hospital related charges covered [1] | ||||||||
|---|---|---|---|---|---|---|---|---|---|
ACT | NSW | VIC | QLD | SA | WA | TAS | NT | Australia | |
Open membership insurers | |||||||||
AIA Health | 68.5% | 77.9% | 83.7% | 82.9% | 86.1% | 84.4% | 79.2% | 86.5% | 81.6% |
Australian Unity | 82.0% | 87.0% | 90.9% | 87.9% | 91.6% | 90.1% | 88.9% | 77.4% | 89.8% |
BUPA | 82.7% | 89.2% | 92.2% | 90.5% | 94.1% | 89.0% | 93.2% | 89.5% | 90.9% |
CBHS Corporate | 94.2% | 80.4% | 87.1% | 90.2% | 87.2% | 81.8% | 93.2% | N/A | 84.7% |
CDH | 35.8% | 94.7% | 87.8% | 88.4% | 93.0% | 89.2% | 81.3% | 100.0% | 93.6% |
CUA Health | 81.2% | 88.7% | 89.2% | 91.2% | 87.7% | 87.0% | 93.2% | 83.1% | 90.4% |
GMHBA | 75.5% | 84.7% | 91.3% | 85.9% | 88.3% | 90.5% | 90.5% | 82.5% | 89.7% |
HBF | 82.4% | 89.5% | 91.6% | 90.2% | 92.4% | 94.8% | 92.9% | 90.4% | 94.4% |
HCF | 83.3% | 90.1% | 91.0% | 89.5% | 92.9% | 88.9% | 91.5% | 86.3% | 90.1% |
HCI | 87.9% | 87.9% | 93.0% | 90.3% | 92.7% | 95.7% | 94.0% | 93.8% | 92.8% |
Health Partners | 80.2% | 88.2% | 90.4% | 89.3% | 94.2% | 87.3% | 89.9% | 81.3% | 93.2% |
HIF | 74.6% | 86.5% | 89.1% | 89.2% | 90.5% | 91.2% | 90.5% | 78.9% | 90.3% |
Latrobe | 83.5% | 89.6% | 91.3% | 88.2% | 89.7% | 83.5% | 92.7% | 88.0% | 91.0% |
MDHF | 95.5% | 92.9% | 92.9% | 89.5% | 93.4% | 78.1% | 83.3% | 82.8% | 92.7% |
Medibank | 84.0% | 89.5% | 92.1% | 89.7% | 91.9% | 90.6% | 93.2% | 90.1% | 90.6% |
NIB | 77.8% | 87.2% | 85.7% | 84.4% | 90.3% | 86.5% | 89.1% | 81.7% | 86.4% |
Onemedifund | 93.9% | 92.0% | 94.4% | 94.4% | 95.1% | 93.7% | 94.3% | N/A | 93.2% |
Peoplecare | 88.2% | 91.1% | 91.9% | 90.2% | 93.5% | 92.2% | 94.7% | 76.1% | 91.3% |
Phoenix | 78.1% | 92.4% | 90.4% | 91.0% | 94.9% | 94.3% | 89.8% | 87.4% | 91.9% |
QCH | 90.2% | 89.6% | 92.0% | 87.3% | 91.1% | 91.6% | 86.7% | 83.4% | 87.4% |
St Lukes | 79.6% | 91.4% | 91.7% | 88.0% | 91.7% | 89.7% | 92.9% | 78.3% | 92.6% |
Transport Health | 86.4% | 88.0% | 92.9% | 90.4% | 91.6% | 80.8% | 94.6% | 83.6% | 92.4% |
Westfund | 84.5% | 92.4% | 88.1% | 90.4% | 90.6% | 90.9% | 92.4% | 87.6% | 91.3% |
Restricted membership insurers | |||||||||
ACA | 89.6% | 94.3% | 95.4% | 94.5% | 94.1% | 92.6% | 93.4% | N/A | 94.4% |
CBHS | 82.7% | 89.7% | 91.9% | 91.8% | 93.6% | 91.5% | 93.2% | 86.1% | 90.9% |
Defence Health | 83.1% | 89.7% | 91.9% | 89.7% | 92.4% | 91.3% | 92.1% | 86.8% | 90.3% |
Doctors' Health | 90.0% | 91.1% | 93.2% | 92.2% | 90.4% | 92.1% | 87.5% | 89.2% | 91.9% |
Navy Health | 83.2% | 90.7% | 92.5% | 90.7% | 91.9% | 91.0% | 93.0% | 87.3% | 90.8% |
Nurses and Midwives | 87.3% | 88.6% | 91.9% | 88.6% | 95.0% | 86.9% | 89.1% | 73.4% | 89.7% |
Police Health | 82.9% | 91.4% | 93.9% | 91.0% | 96.2% | 92.2% | 94.9% | 89.6% | 92.8% |
Reserve Bank | 91.9% | 90.1% | 96.9% | 95.3% | 97.1% | 98.6% | 97.5% | N/A | 93.0% |
RT Health Fund | 78.1% | 94.3% | 92.3% | 92.4% | 94.7% | 93.1% | 90.1% | 59.9% | 93.2% |
Teachers Health | 86.9% | 91.2% | 91.9% | 91.7% | 93.0% | 91.0% | 92.9% | 89.8% | 91.3% |
TUH | 87.4% | 89.2% | 88.9% | 91.0% | 91.1% | 94.6% | 93.8% | 96.6% | 90.9% |
Industry average | 82.9% | 89.4% | 91.5% | 89.7% | 93.4% | 92.7% | 92.9% | 89.3% | 90.6% |
Note
- [1] Includes charges for hospital accommodation, theatre costs, prostheses and specialist fees (not including the Medicare benefit) and associated benefits (after any excesses and co-payments are deducted).
- 'N/A' signifies no activity in that state.
- 100% is likely to indicate small numbers (eg. only 1 episode).
- As Nurses and Midwives merged with Teachers Health on 1st January 2022, it reported the charges covered up to the date of merger.
- As RT Health merged with HCF on 1st November 2021, it reported the charges covered up to the date of merger.
Medical gap schemes
'Medical gap schemes' are intended to reduce patients' out of pocket costs for in-hospital medical services.
If a service is 'no gap', it means the patient did not incur any costs, as the full cost was covered by Medicare and the health fund. If a health insurer has a higher percentage of services covered at no gap than other insurers, it indicates the insurer has a more effective gap scheme in that state.
Insurer gap schemes and agreements
Doctors are free to decide whether to use a particular insurer's gap cover arrangements for each patient. Factors that can affect the acceptance of the scheme by doctors include:
- whether the insurer has a substantial share of the health insurance market in a particular state or region
- the level of insurer benefits paid under the gap arrangements (compared with the doctor's desired fee)
- the design of the insurer's gap cover arrangements including any administrative burden for the doctor.
State-based differences
This report includes information on a state basis because the effectiveness of some insurers' gap schemes can differ between states and these differences are not apparent in the national figures.
Most differences are due to the level of doctors' fees, which can vary significantly between different states, and between regional areas and capital cities. In some states, insurers can cover gaps more effectively because doctors in that location charge less than the national average. In addition, where a doctor's fee for an in-hospital service is at or below the Medicare Benefits Schedule fee, there will be no gap to the member.
If a health insurer's percentage of services with no gap is higher than that of an insurer in another state, it does not necessarily mean the insurer's scheme is more effective because state-based differences could be the cause.
Information is not provided for some insurers in some states, as insurers do not report numbers to APRA for states in which they do not have a sufficiently large membership. In those cases, the figures are included in those for the state in which the insurer has the largest number of members.
Comparing different gap schemes
If a health insurer has a higher percentage of services covered at no gap (in the same state/territory) compared with another insurer, this indicates it has a more effective gap scheme in that state. This means it is more likely that a medical service can be provided at no cost to the consumer, but it does not guarantee that a particular doctor will choose to use the insurer's gap scheme.
Percentage of services with no gaps - the proportion of services for which a gap is not payable by the patient after accounting for insurer benefits, schemes and agreements.
Percentage of services with no gap or where known gap payment made - this table includes both the percentage of no gap services and what is called 'known gap' services. Known gap schemes are an arrangement where the insurer pays an additional benefit on the understanding that the provider advises the patient of costs upfront.
These tables consider all the insurer's policies. The information in the tables is not indicative of any individual policy offered by the insurer but is an average across the insurer's total membership.
Table 4A: Medical services with no gap
Fund Name (Abbreviated) | % of Services with no gap | ||||||||
|---|---|---|---|---|---|---|---|---|---|
ACT | NSW | VIC | QLD | SA | WA | TAS | NT | Australia | |
Open membership insurers | |||||||||
AIA Health | 73.6% | 81.6% | 84.5% | 87.0% | 87.1% | 85.9% | 80.8% | 78.6% | 84.2% |
Australian Unity | 79.6% | 91.7% | 91.7% | 91.8% | 92.2% | 89.2% | 91.2% | 82.8% | 91.7% |
BUPA | 81.9% | 90.9% | 91.5% | 92.8% | 91.9% | 89.3% | 92.8% | 90.3% | 91.6% |
CBHS Corporate | 67.5% | 82.4% | 88.9% | 82.4% | 88.2% | 76.3% | 28.6% | N/A | 82.8% |
CDH | 0.0% | 84.9% | 65.5% | 69.4% | 72.9% | 92.9% | 64.3% | 100.0% | 82.7% |
CUA Health | 84.8% | 91.7% | 89.5% | 93.4% | 87.2% | 84.3% | 94.1% | 97.3% | 92.5% |
GMHBA | 74.0% | 81.4% | 85.4% | 84.0% | 86.3% | 85.3% | 75.2% | 80.7% | 84.7% |
HBF | 79.3% | 87.2% | 86.3% | 89.3% | 88.6% | 93.3% | 92.8% | 88.7% | 92.8% |
HCF | 74.3% | 89.1% | 87.5% | 86.3% | 86.6% | 83.3% | 91.7% | 89.9% | 87.8% |
HCI | 73.4% | 89.7% | 91.5% | 90.5% | 82.6% | 94.4% | 93.2% | N/A | 91.8% |
Health Partners | 79.6% | 91.9% | 88.9% | 90.5% | 92.1% | 86.6% | 87.9% | 89.2% | 91.7% |
HIF | 70.9% | 88.3% | 88.3% | 90.5% | 85.9% | 89.5% | 92.4% | 78.6% | 89.2% |
Latrobe | 65.6% | 79.1% | 76.3% | 80.0% | 82.2% | 71.3% | 77.5% | 100.0% | 76.7% |
MDHF | 70.7% | 84.0% | 81.3% | 71.6% | 83.9% | 88.3% | 72.7% | 60.0% | 81.3% |
Medibank | 76.1% | 86.8% | 85.7% | 84.2% | 82.7% | 75.5% | 91.3% | 85.2% | 84.6% |
NIB | 66.1% | 93.2% | 90.1% | 89.4% | 94.1% | 93.0% | 93.7% | 80.5% | 91.8% |
Onemedifund | 46.2% | 90.0% | 89.2% | 92.6% | 89.0% | 88.5% | 93.0% | N/A | 90.1% |
Peoplecare | 88.3% | 91.8% | 90.3% | 91.5% | 89.7% | 84.1% | 93.4% | 76.1% | 91.0% |
Phoenix | 73.6% | 93.2% | 89.6% | 92.7% | 92.7% | 92.0% | 84.5% | 84.0% | 92.2% |
QCH | 86.1% | 90.7% | 91.9% | 89.3% | 87.2% | 87.3% | 90.4% | 86.6% | 89.3% |
St Lukes | 55.6% | 79.7% | 82.4% | 77.3% | 81.6% | 78.6% | 90.4% | 40.0% | 89.0% |
Transport Health | 50.0% | 86.9% | 90.5% | 88.3% | 78.2% | 84.9% | 90.6% | 70.0% | 90.1% |
Westfund | 79.6% | 92.5% | 87.3% | 89.7% | 86.1% | 90.0% | 92.0% | 88.2% | 90.9% |
Restricted membership insurers | |||||||||
ACA | 81.7% | 92.9% | 92.4% | 93.8% | 89.1% | 88.2% | 92.1% | N/A | 92.8% |
CBHS | 75.5% | 88.0% | 86.9% | 73.3% | 87.2% | 85.9% | 87.8% | 81.3% | 84.7% |
Defence Health | 79.3% | 90.1% | 90.5% | 91.5% | 89.9% | 88.3% | 90.9% | 88.0% | 90.2% |
Doctors' Health | 91.2% | 91.6% | 93.8% | 93.0% | 91.9% | 89.1% | 80.5% | 82.2% | 92.4% |
Navy Health | 81.4% | 91.0% | 91.2% | 91.1% | 90.9% | 87.7% | 92.5% | 89.6% | 90.4% |
Nurses and Midwives | 90.1% | 89.9% | 88.2% | 89.8% | 90.5% | 84.2% | 91.2% | 77.4% | 89.3% |
Police Health | 75.2% | 87.7% | 85.9% | 88.0% | 88.8% | 86.1% | 87.2% | 84.8% | 87.6% |
Reserve Bank | 68.2% | 89.8% | 93.8% | 94.6% | 94.3% | 96.2% | 87.1% | N/A | 91.6% |
RT Health Fund | 79.5% | 93.9% | 90.6% | 93.7% | 93.7% | 93.0% | 95.8% | 75.0% | 93.5% |
Teachers Health | 84.3% | 91.3% | 89.7% | 91.6% | 89.7% | 87.3% | 90.8% | 90.7% | 90.8% |
TUH | 76.1% | 92.2% | 88.1% | 92.0% | 94.0% | 90.5% | 94.8% | 98.6% | 91.9% |
Industry average | 76.9% | 89.7% | 88.0% | 88.8% | 89.7% | 88.5% | 91.4% | 87.5% | 88.8% |
Note
- 'N/A' signifies no activity in that state.
- 100 per cent is likely to indicate small numbers (e.g. only 1 episode).
- As Nurses and Midwives merged with Teachers Health on 1st January 2022, it reported the charges covered up to the date of merger.
- As RT Health merged with HCF on 1st November 2021, it reported the charges covered up to the date of merger.
Table 4B: Medical services with no gap or where known gap payment made
Fund Name (Abbreviated) | % of Services with no gap or where known gap payment made | ||||||||
|---|---|---|---|---|---|---|---|---|---|
ACT | NSW | VIC | QLD | SA | WA | TAS | NT | Australia | |
Open membership insurers | |||||||||
AIA Health | 87.8% | 92.8% | 97.1% | 95.9% | 99.5% | 96.1% | 100.0% | 100.0% | 95.6% |
Australian Unity | 91.5% | 96.9% | 98.3% | 97.5% | 99.1% | 97.7% | 97.6% | 90.0% | 98.0% |
BUPA | 94.5% | 96.9% | 99.2% | 98.6% | 99.6% | 97.5% | 99.2% | 97.5% | 98.3% |
CBHS Corporate | 83.1% | 91.6% | 94.4% | 93.3% | 92.0% | 89.4% | 28.6% | N/A | 91.9% |
CDH | 0.0% | 95.9% | 88.0% | 94.4% | 97.9% | 100.0% | 95.2% | 100.0% | 95.3% |
CUA Health | 94.2% | 97.2% | 98.4% | 98.5% | 98.1% | 95.9% | 97.7% | 97.8% | 98.2% |
GMHBA | 85.0% | 89.8% | 94.7% | 92.5% | 98.3% | 94.4% | 82.1% | 93.6% | 93.8% |
HBF | 99.6% | 99.6% | 99.8% | 99.8% | 100.0% | 99.8% | 99.8% | 99.8% | 99.8% |
HCF | 95.3% | 97.6% | 99.2% | 98.0% | 99.7% | 97.4% | 99.2% | 96.6% | 98.0% |
HCI | 85.3% | 96.2% | 98.1% | 97.4% | 99.8% | 97.8% | 99.1% | N/A | 98.3% |
Health Partners | 89.4% | 97.7% | 98.7% | 98.1% | 99.8% | 96.8% | 98.7% | 94.9% | 99.5% |
HIF | 91.2% | 96.0% | 98.2% | 98.3% | 99.3% | 97.8% | 97.8% | 90.8% | 97.8% |
Latrobe | 98.8% | 98.4% | 99.7% | 98.1% | 99.6% | 100.0% | 99.3% | 100.0% | 99.6% |
MDHF | 99.0% | 99.8% | 100.0% | 99.4% | 99.9% | 100.0% | 100.0% | 100.0% | 99.9% |
Medibank | 94.9% | 97.0% | 97.7% | 95.9% | 99.2% | 91.3% | 98.8% | 96.4% | 96.6% |
NIB | 66.2% | 93.5% | 91.5% | 89.8% | 94.1% | 93.6% | 93.9% | 80.5% | 92.3% |
Onemedifund | 76.9% | 96.7% | 98.8% | 99.1% | 99.4% | 97.6% | 99.7% | N/A | 97.8% |
Peoplecare | 96.9% | 97.7% | 98.9% | 98.0% | 99.1% | 97.8% | 99.6% | 80.7% | 98.2% |
Phoenix | 90.9% | 98.1% | 98.5% | 98.2% | 99.8% | 98.3% | 97.0% | 96.0% | 98.4% |
QCH | 89.4% | 97.0% | 98.4% | 97.7% | 99.5% | 95.1% | 98.5% | 93.9% | 97.7% |
St Lukes | 82.2% | 91.2% | 96.3% | 93.8% | 95.5% | 88.6% | 98.9% | 66.7% | 98.3% |
Transport Health | 100.0% | 95.8% | 98.1% | 97.2% | 100.0% | 96.6% | 100.0% | 70.0% | 98.0% |
Westfund | 94.7% | 98.0% | 98.1% | 98.1% | 96.8% | 99.0% | 98.4% | 97.6% | 98.0% |
Restricted membership insurers | |||||||||
ACA | 93.3% | 97.6% | 98.7% | 98.1% | 98.4% | 97.4% | 98.1% | N/A | 97.8% |
CBHS | 91.9% | 96.5% | 98.0% | 97.8% | 99.2% | 98.0% | 98.8% | 93.9% | 97.3% |
Defence Health | 92.8% | 96.8% | 98.8% | 98.0% | 99.4% | 97.8% | 98.3% | 95.7% | 97.9% |
Doctors' Health | 97.2% | 98.0% | 98.9% | 99.0% | 99.2% | 98.1% | 97.1% | 99.5% | 98.5% |
Navy Health | 92.8% | 97.0% | 98.8% | 97.9% | 99.3% | 97.6% | 98.8% | 94.3% | 97.7% |
Nurses and Midwives | 95.8% | 96.9% | 97.8% | 96.1% | 99.7% | 95.8% | 99.4% | 83.9% | 97.1% |
Police Health | 89.1% | 95.7% | 97.3% | 97.0% | 99.4% | 97.3% | 98.6% | 95.0% | 97.7% |
Reserve Bank | 85.7% | 95.7% | 99.2% | 98.6% | 99.4% | 101.3% | 97.9% | N/A | 97.3% |
RT Health Fund | 90.7% | 98.4% | 99.3% | 98.6% | 100.0% | 97.6% | 100.0% | 95.0% | 98.5% |
Teachers Health | 94.7% | 97.4% | 98.8% | 98.3% | 99.6% | 97.4% | 98.9% | 97.2% | 97.7% |
TUH | 94.7% | 98.0% | 98.9% | 98.4% | 99.5% | 95.3% | 99.6% | 100.0% | 98.4% |
Industry average | 92.3% | 96.7% | 97.9% | 97.2% | 99.3% | 97.5% | 98.8% | 96.5% | 97.4% |
Note
- 'N/A' signifies no activity in that state.
- 100 per cent is likely to indicate small numbers (e.g. only 1 episode).
- As Nurses and Midwives merged with Teachers Health on 1st January 2022, it reported the charges covered up to the date of merger.
- As RT Health merged with HCF on 1st November 2021, it reported the charges covered up to the date of merger.
General treatment (extras)
General treatment policies, also known as 'ancillary' or 'extras' provide benefits towards a range of out-of-hospital health services. The most common services are dental, optical, physiotherapy and non-Pharmaceutical Benefits Scheme prescription medicines.
Table 5 shows the average proportion of service charges covered by each insurer per state for all their policies and services.
General treatment policies provide benefits towards a range of health-related services not provided by a doctor, including, but not limited to:
- dental fees and charges
- optometry - cost of glasses and lenses
- physiotherapy, chiropractic services and other therapies including natural and complementary therapies
- prescribed medicines not covered by the Pharmaceutical Benefits Scheme.
Percentage of charges covered, all services, by state
Table 5 indicates what proportion of total charges, associated with general treatment services, is covered by each insurer's benefits. This is an average of outcomes across each insurer's general treatment policies and services. Higher cost policies will generally cover a greater proportion of charges than indicated by this average, while cheaper policies may cover less.
Table 5: General treatment (extras)
Fund Name (Abbreviated) | % General treatment (extras) Charges covered | ||||||||
|---|---|---|---|---|---|---|---|---|---|
ACT | NSW | VIC | QLD | SA | WA | TAS | NT | Australia | |
Open membership insurers | |||||||||
AIA Health | 44.7% | 46.5% | 48.4% | 47.4% | 50.9% | 48.5% | 46.8% | 52.3% | 47.5% |
Australian Unity | 45.1% | 48.6% | 50.8% | 50.9% | 55.0% | 50.2% | 47.0% | 49.5% | 50.5% |
BUPA | 46.2% | 48.9% | 47.5% | 51.4% | 54.9% | 56.5% | 49.3% | 58.8% | 50.7% |
CBHS Corporate | 58.1% | 49.2% | 54.1% | 51.9% | 50.4% | 50.8% | 54.8% | N/A | 50.6% |
CDH | 36.0% | 34.7% | 36.2% | 30.0% | 33.5% | 46.3% | 36.8% | N/A | 34.5% |
CUA Health | 43.2% | 49.7% | 40.3% | 46.2% | 48.2% | 47.0% | 45.9% | 44.6% | 46.2% |
GMHBA | 46.9% | 48.4% | 47.7% | 49.6% | 50.5% | 48.3% | 47.4% | 45.8% | 48.2% |
HBF | 49.1% | 51.7% | 52.2% | 52.1% | 54.4% | 56.9% | 51.9% | 54.0% | 56.3% |
HCF | 49.4% | 47.8% | 54.7% | 54.7% | 61.4% | 59.8% | 52.1% | 54.5% | 51.5% |
HCI | 38.8% | 50.7% | 44.5% | 47.0% | 52.0% | 47.3% | 43.2% | 49.3% | 45.3% |
Health Partners | 56.2% | 55.5% | 45.6% | 41.7% | 57.4% | 44.6% | 45.0% | 47.4% | 56.9% |
HIF | 41.6% | 45.6% | 46.5% | 46.0% | 49.9% | 47.6% | 45.0% | 42.6% | 47.1% |
Latrobe | 35.9% | 43.2% | 40.0% | 43.0% | 47.4% | 47.2% | 39.4% | 35.4% | 40.6% |
MDHF | 47.2% | 53.4% | 52.7% | 51.2% | 49.7% | 48.9% | 43.3% | 45.6% | 52.6% |
Medibank | 48.0% | 50.4% | 52.7% | 54.4% | 58.0% | 57.6% | 53.4% | 59.8% | 53.4% |
NIB | 55.5% | 55.7% | 59.6% | 56.5% | 60.0% | 62.3% | 55.2% | 58.8% | 57.2% |
Onemedifund | 36.7% | 49.4% | 53.3% | 49.5% | 53.2% | 52.1% | 52.0% | N/A | 51.0% |
Peoplecare | 43.6% | 46.3% | 43.1% | 44.4% | 50.7% | 43.5% | 44.2% | 48.1% | 45.1% |
Phoenix | 57.8% | 53.1% | 55.5% | 54.7% | 53.6% | 55.1% | 54.3% | 53.1% | 54.1% |
QCH | 40.9% | 46.3% | 48.1% | 49.3% | 49.7% | 48.2% | 48.2% | 46.0% | 49.2% |
St Lukes | 51.8% | 59.2% | 56.8% | 57.7% | 63.9% | 57.5% | 57.1% | 49.3% | 57.3% |
Transport Health | 36.2% | 47.6% | 50.8% | 44.0% | 49.6% | 45.0% | 44.8% | 40.3% | 49.3% |
Westfund | 38.1% | 45.6% | 42.3% | 47.4% | 45.7% | 43.9% | 40.9% | 40.6% | 46.1% |
Restricted membership insurers | |||||||||
ACA | 58.4% | 55.1% | 56.0% | 58.3% | 61.0% | 58.6% | 50.6% | 65.7% | 56.2% |
CBHS | 44.5% | 47.7% | 49.0% | 50.4% | 53.6% | 50.3% | 48.5% | 47.9% | 48.8% |
Defence Health | 38.3% | 41.7% | 43.7% | 44.7% | 48.3% | 44.3% | 42.0% | 45.1% | 43.7% |
Doctors' Health | 55.2% | 52.6% | 53.6% | 55.1% | 57.4% | 53.8% | 51.9% | 54.5% | 53.7% |
Navy Health | 43.5% | 46.7% | 51.5% | 50.8% | 49.2% | 52.6% | 48.8% | 49.7% | 49.1% |
Nurses and Midwives | 43.0% | 49.6% | 47.8% | 49.5% | 50.2% | 47.3% | 48.1% | 46.9% | 48.9% |
Police Health | 62.7% | 65.2% | 66.3% | 66.0% | 69.4% | 67.3% | 65.9% | 67.3% | 67.2% |
Reserve Bank | 56.7% | 70.2% | 74.0% | 72.5% | 76.0% | 75.2% | 70.8% | 28.9% | 71.2% |
RT Health Fund | 34.9% | 42.2% | 39.9% | 43.7% | 47.3% | 41.1% | 34.2% | 38.0% | 42.6% |
Teachers Health | 40.0% | 45.4% | 45.2% | 46.4% | 48.9% | 47.8% | 44.3% | 43.5% | 45.6% |
TUH | 44.1% | 46.9% | 46.0% | 53.5% | 48.5% | 47.8% | 48.1% | 47.5% | 52.8% |
Industry average | 47.0% | 49.1% | 50.8% | 52.5% | 56.4% | 56.6% | 52.6% | 58.4% | 52.0% |
Note
- 'N/A' signifies no activity in that state.
- 100 per cent is likely to indicate small numbers (e.g. only 1 episode).
- As Nurses and Midwives merged with Teachers Health on 1st January 2022, it reported the charges covered up to the date of merger.
- As RT Health merged with HCF on 1st November 2021, it reported the charges covered up to the date of merger.
1 For the purposes of this report, "health insurers" refers to "health funds".
2 APRA releases quarterly private health insurance statistics for June 2022:
https://www.apra.gov.au/news-and-publications/apra-releases-quarterly-private-health-insurance-statistics-for-june-2022
3 Australian Competition and Consumer Commission (ACCC) - Private health insurance report 2021-22, p. 11:
https://www.accc.gov.au/publications/private-health-insurance-reports/private-health-insurance-report-2021-22
4 Complaints investigated were referred to as "disputes" in previous versions of this report.
5 The 'Operations of the Private Health Insurers' report is available on the APRA website: apra.gov.au